Archives: maps

  • / By

Geography and Language – How do you pronounce “pecan?”

Let’s take a moment to talk about language and geography. Human geography studies culture and linguistics or language has to do with culture. So, geography studies language, and in fact it can study it in multiple ways. Geography of languages studies the distribution and movement of languages around the world, while linguistic geography studies language variations across regions, such as dialects.

As someone who has tried to disassociate himself from where he grew up (due to complex factors), I like to think I have a pretty good control over my dialect. It was pretty easy to stop using “wicked” as an adjective. Just now you have most likely done some instant linguistic geography thinking and figured out the region I grew up with down to a radius of about 60 miles. Come fall and Thanksgiving, I just can’t bring myself to talk like most other people in the Pacific Northwest. I love pecan pie and I pronounce it “pee-KAN” pie. I’m often corrected or given a strange look(the same way I looked at people when I first went off to college and heard someone call a grocery bag a “sack”). Most people here say “pee-kon” pie.

So, how do you say “pecan” and how is that affected by your geographical history? In 2003, Harvard conducted some surveys on dialect in the US. They mapped out the responses based on where people lived during formative language development years. Check out the maps of the Pecan Survey here.

You can also see the survey applied to Google Maps here.

To view more maps of more dialectic surveys from Harvard, view the list of the 2003 survey results here.

If you’d like to take part in similar dialect surveys, you can take part in Cambridge’s survey here.

Pecan Dialect Survey Results.

Come back again as I’ll make a few more posts about Geography and Language this week.

  • / By

The Geography of Horror

ESRI has put out this great “Geography of Horror” map, just in time for Halloween. It’s a map of where the top rated horror movies (about 250 of them) take place. You can explore the the locations via decades of movie releases.

This kind of thing brings up questions I wish I had time to explore. How do horror movies influence the perception of location? What geographic characteristics contribute well to horror? It would also be interesting to try and find remakes that have been done of movies and compare how the locations play a role in each story. For example, compare The Ring (2001) which takes place in Seattle, with the original Ring (1998) set in Japan.

The Geography of Horror.


  • / By

Beautiful Hand-Made Globes

Peter Bellerby – The Globemaker from Cabnine on Vimeo.

This excellent video shows a bit of behind the scenes of the craftsmanship put into these globes. Peter Bellerby, founder of Bellerby & Co., reflects on the long process of figuring out how to best make a globe.

These globes don’t come cheap though. The craftsmanship and detail has a price. A “mini” desktop globe starts at £999.00. Not quite something you’d put in the classroom, but the art of constructing a globe would hopefully inspire many.

via Wired


  • / By

Pizza Place Geography

I might have to say that the one combination I probably love more than geography and zombies is geography and pizza. I have a tattoo about pizza that is too embarrassing to share on the internet.

Flowing Data used a data set of closest pizza places in a 10 mile radius to create various maps showing distribution of popular pizza places.

The blog post also gets into some thoughts on regions and migration of ideas when making suggestions about why the pizza places are as popular in different areas as they are:

Regionally, Papa John’s, which started in Kentucky, is strong in the east central area; Godfather’s, with headquarters in Nebraska, is popular in the midwest; Little Caesars shows strong in California and Michigan (its first location in Garden City, Michigan); and Papa Murphy’s is strong in the northwest, which makes sense because it started in Washington.

Pizza locations


A few years ago, Floating Sheep created what they call the “Great American ‘Pizza’ Map.” It’s a very interesting map that plots out internet user references to pizza, guns, and adult clubs. In the comments there are the start of some great geographic discussions and questions around culture and location, but since it refers to adult clubs, I’ll let you decide if you want to draw from that resource. Maybe for the much older kids. However, the Pizza Place Geography maps at Flowing Data is a great resource to give to students. Just know that it will make them hungry.

Pizza place geography.

  • / By

Britain Mapped in Minecraft

Ordnance Survey took their actual topographical data  as well as image data, but instead of  putting them  into a GIS program, they scaled it down and put it into Minecraft. They used different block materials to display different features (for example, the gold blocks are minor roads).

Minecraft players can even download the map and explore it. However, it’s a massive file.

I think this is exciting. I love the idea of combining real-world data and games. Could this be a way to get students interested  in GIS? Essentially, Minecraft has been turned  into a very basic GIS program.

Follow the link to find out more about how they did it. Use the article as an engaging reading extension for students interested in Minecraft and/or GIS..

via Minecrafting with OS OpenData | Innovate | Ordnance Survey.

Here is also a nice video from Ordnance Survey that explains GIS:

  • / By

Mental Mapping on The Walking Dead

SPOILER ALERT: I’m talking a lot about characters and plot points in The Walking Dead Season 3, Episode 12 “Clear.” I don’t intend to give anything away, but if you want to stay surprised and haven’t watched season 3 yet, you might want to bookmark this post and come back later.

I strongly believe that geography skills will be a major benefit in the zombie apocalypse. So I’m always excited when I notice characters using those geographic skills in zombie stories.

In the 3rd season of The Walking Dead, Rick, Michonne, and Carl go for a supply run. They run into Morgan who has been holed up in Rick’s old neighborhood. Morgan was surviving all on his own and he did so by setting up some elaborate traps all over where he was staying. Something else that helped him survive was mental mapping.

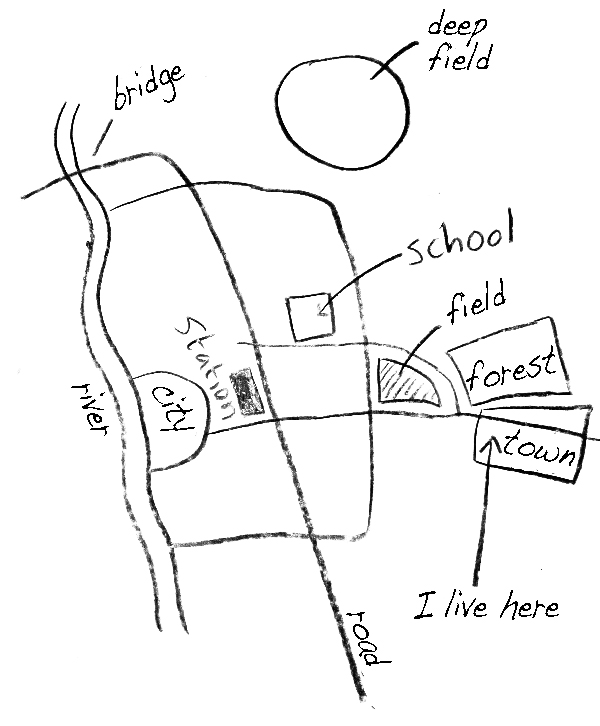
A mental map is how someone pictures the world around them. It really is the map that someone has in his or her mind. It’s often made of a combination of what you know and what you think. The drawing below shows an example of a mental map that has been sketched out:

Mental Map

The mental map is probably not completely accurate. However, it gives good insight into what the person who drew it remembers or finds important.

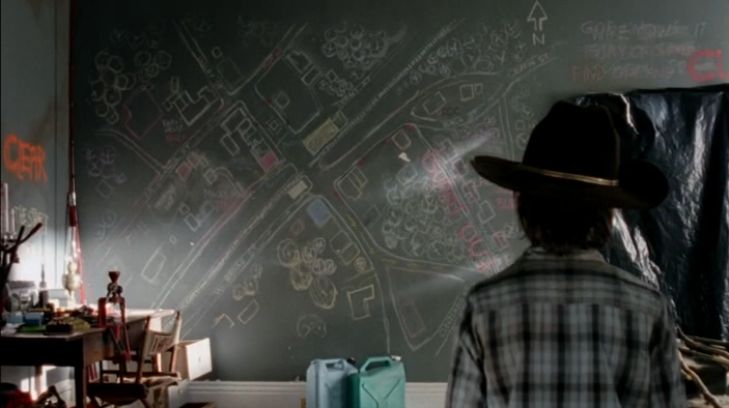
Let’s get back to The Walking Dead and see how Morgan used his mental mapping skills. See the map Morgan sketched on the wall of his hideout:

Walking_Dead_Mental_Map

Quality Mapping

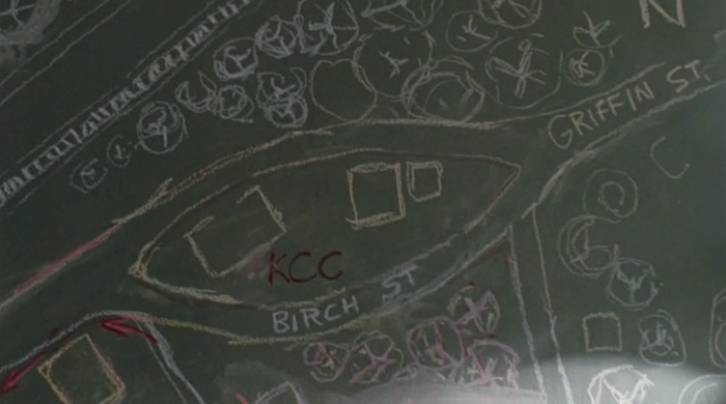
First of all, I want to congratulate Morgan for making a quality map. We can see that he included direction in the top right, showing which way is North. We can see that he used many clear symbols for roads, trees, houses and other buildings. He also used labels, which we can see when Carl examines closer. It is hard to tell if it is to scale, but judging by the relative size of the buildings, it is probably accurate enough for Morgan’s needs.

Walking_Dead_Mental_Map3

Analyzing Mental Maps

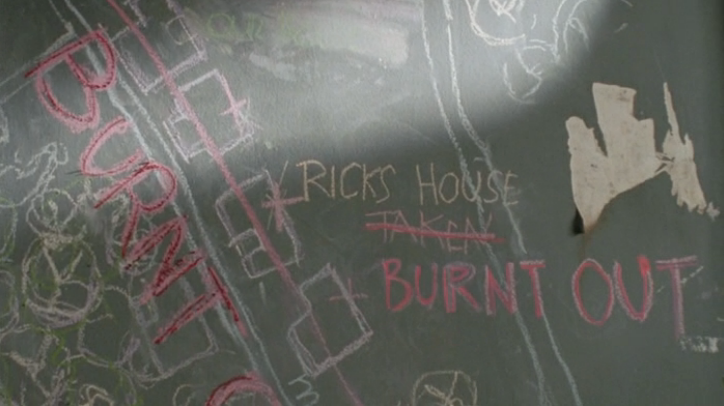
It is a valuable skill to analyze someone’s mental map. Through this analysis, we can tell what was important to the mental cartographer. It appears that Morgan has been keeping track of which houses are “Taken” or “Burnt Out,” possibly even which areas are “clear.” It is definitely important for Morgan to keep track of which areas are overrun and which areas are safe enough to journey into.

But even more interestingly, try to determine what Morgan thought about Rick.

Morgan may be good at mapping, but not so good at using apostrophes.

Morgan may be good at mapping, but not so good at using apostrophes.

Morgan kept close track of Rick’s house. You can see that he updated it to being “TAKEN” and then to be “BURNT OUT.” Morgan didn’t seem to keep as close track of any other houses. This might mean that Morgan was still thinking about Rick, caring about the state of his property, and caring about the state of Rick.

Updating Your Mental Maps

Morgan took part in another important skill in mental mapping; he updated his mental map. As you learn more about locations, you should keep updating the data on your mental map. We can see that Morgan crossed out and added new labels, making updates as they were needed. Similarly, when you learn about the world around you, you should update your understanding of the world.

In the zombie apocalypse mental maps become very important. We lose access to map references and need to rely on our mental maps. Morgan did a good job keeping his mental map up to date and that probably kept him alive. However, it didn’t keep him sane.

  • / By

Lesson Slideshows for Members

I’ll be posting slideshows to go with project lessons. These are available to all members on ZombieBased.com.

The slideshow for the first lesson of project 01 is the first to go up. It’s available on the Project 01 page.

Below is a PDF of the slides.

  • / By
Maps » Population Density Maps

Maps » Population Density Maps

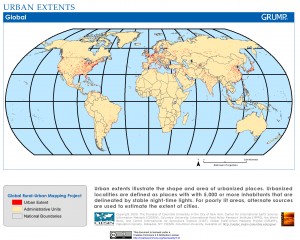
If you’re teaching, learning, or working on a project that requires you to find resources on population density, make sure you check out the Global Rural-Urban Mapping Project (GRUMP) hosted at Columbia University. They compile data from NASA nighttime photos from space to create maps of where people are located (the same method used in ZBL Project 01 and Dead Reckon).

Take a look at the site and browse some of the awesome maps they have. If you are doing any research of a country, these maps will be valuable to you. You can even register to download specific data.

Maps » Population Density Grid, v1: Global Rural-Urban Mapping Project GRUMP, v1 | SEDAC.