Archives: geography

  • / By

Geography and Language – How do you pronounce “pecan?”

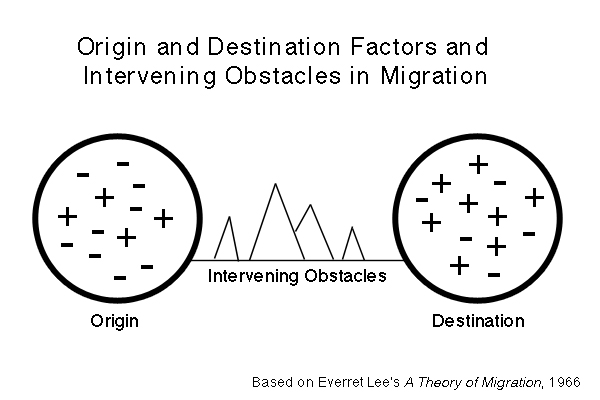
Let’s take a moment to talk about language and geography. Human geography studies culture and linguistics or language has to do with culture. So, geography studies language, and in fact it can study it in multiple ways. Geography of languages studies the distribution and movement of languages around the world, while linguistic geography studies language variations across regions, such as dialects.

As someone who has tried to disassociate himself from where he grew up (due to complex factors), I like to think I have a pretty good control over my dialect. It was pretty easy to stop using “wicked” as an adjective. Just now you have most likely done some instant linguistic geography thinking and figured out the region I grew up with down to a radius of about 60 miles. Come fall and Thanksgiving, I just can’t bring myself to talk like most other people in the Pacific Northwest. I love pecan pie and I pronounce it “pee-KAN” pie. I’m often corrected or given a strange look(the same way I looked at people when I first went off to college and heard someone call a grocery bag a “sack”). Most people here say “pee-kon” pie.

So, how do you say “pecan” and how is that affected by your geographical history? In 2003, Harvard conducted some surveys on dialect in the US. They mapped out the responses based on where people lived during formative language development years. Check out the maps of the Pecan Survey here.

You can also see the survey applied to Google Maps here.

To view more maps of more dialectic surveys from Harvard, view the list of the 2003 survey results here.

If you’d like to take part in similar dialect surveys, you can take part in Cambridge’s survey here.

Pecan Dialect Survey Results.

Come back again as I’ll make a few more posts about Geography and Language this week.

  • / By

The Geography of Horror

ESRI has put out this great “Geography of Horror” map, just in time for Halloween. It’s a map of where the top rated horror movies (about 250 of them) take place. You can explore the the locations via decades of movie releases.

This kind of thing brings up questions I wish I had time to explore. How do horror movies influence the perception of location? What geographic characteristics contribute well to horror? It would also be interesting to try and find remakes that have been done of movies and compare how the locations play a role in each story. For example, compare The Ring (2001) which takes place in Seattle, with the original Ring (1998) set in Japan.

The Geography of Horror.


  • / By

Geography Question Generator

I’m tired of people thinking of geography as memorizing locations and capitals. Geography is so much more. There are unlimited amazing questions that geographers take on to help us better understand how the earth affects us.

In an attempt to help people imagine these big questions, I created the Geography Question Generator. It randomly creates questions that a geographer could explore. Right now it can generate about a couple hundred questions, a few might make a little less sense (no artificial intelligence in this tool). I’ll keep adding elements to it to create more questions. They mostly stick to broad topics in geography.

My hope is that people will take a little bit of time to consider the exciting questions that geography can help us explore.

Check out the tool here.

This tool goes great with the first lesson in Zombie-Based Learning, but can be used at any point to show that geography is a pretty deep field.

  • / By

Dead Reckon is now on Kindle

Dead Reckon on Amazon

Dead Reckon in the Amazon Store

Dead Reckon is now available on Kindle! The comic has special functions to allow you to zoom into each panel. For Kindle users or Kindle app users, this will hopefully be an easier and even cheaper way to access the comic. The geography project notes are also included and zoomable as well. I’d love to hear any feedback on it.

Viewing Comics on Kindle

This was put together in a special way so that you can click on each comic panel and zoom into it. You can then progress through each panel automatically. I do a lot of comic reading on my mobile devices, and I really like being able to view a comic panel by panel. Hopefully you’ll enjoy this too.

Comic on Kindle

Dead Reckon zooms in on panels in Kindle


Free Preview

You can get a free preview on Amazon using the Kindle Cloud Viewer, it is very easy to do. See below for some instructions from Amazon.

Amazon Kindle Device: Your sample will be sent automatically and wirelessly to the Kindle via Amazon Whispernet. Don’t have a Kindle? Get yours here.

Free Reading Apps: Your sample will be sent automatically to your AndroidiPadiPhonePCMacBlackBerry, orWindows Phone 7 device. Don’t have a free Kindle Reading App? Download one here.

  • / By

Pizza Place Geography

I might have to say that the one combination I probably love more than geography and zombies is geography and pizza. I have a tattoo about pizza that is too embarrassing to share on the internet.

Flowing Data used a data set of closest pizza places in a 10 mile radius to create various maps showing distribution of popular pizza places.

The blog post also gets into some thoughts on regions and migration of ideas when making suggestions about why the pizza places are as popular in different areas as they are:

Regionally, Papa John’s, which started in Kentucky, is strong in the east central area; Godfather’s, with headquarters in Nebraska, is popular in the midwest; Little Caesars shows strong in California and Michigan (its first location in Garden City, Michigan); and Papa Murphy’s is strong in the northwest, which makes sense because it started in Washington.

Pizza locations


A few years ago, Floating Sheep created what they call the “Great American ‘Pizza’ Map.” It’s a very interesting map that plots out internet user references to pizza, guns, and adult clubs. In the comments there are the start of some great geographic discussions and questions around culture and location, but since it refers to adult clubs, I’ll let you decide if you want to draw from that resource. Maybe for the much older kids. However, the Pizza Place Geography maps at Flowing Data is a great resource to give to students. Just know that it will make them hungry.

Pizza place geography.

  • / By

Britain Mapped in Minecraft

Ordnance Survey took their actual topographical data  as well as image data, but instead of  putting them  into a GIS program, they scaled it down and put it into Minecraft. They used different block materials to display different features (for example, the gold blocks are minor roads).

Minecraft players can even download the map and explore it. However, it’s a massive file.

I think this is exciting. I love the idea of combining real-world data and games. Could this be a way to get students interested  in GIS? Essentially, Minecraft has been turned  into a very basic GIS program.

Follow the link to find out more about how they did it. Use the article as an engaging reading extension for students interested in Minecraft and/or GIS..

via Minecrafting with OS OpenData | Innovate | Ordnance Survey.

Here is also a nice video from Ordnance Survey that explains GIS:

  • / By

Post-Apocalyptic Push and Pull Factors

When we analyze human migration we are analyzing how people move. To do this, we need to look at some of the reasons people move. This is where the theory of push and pull factors comes in handy. Push factors are reasons to leave a place and pull factors are reasons to go to a place.

© Telltale Games

© Telltale Games
Interestingly enough, Lee Everett is a character in The Walking Dead’s Telltale Games mobile game. Both Lee Everett and Everett Lee also taught at University of Georgia.

The model behind push and pull factors was developed by a professor named Everett Lee. He published his theories on push and pull factors in an article called A Theory of Migration in 1966. In this article, he defined push and pull factors and provided examples of both. He noted that push and pull factors may be different for different people. Lee (1966) described an example with the following:

Thus a good climate is attractive and a bad climate is repulsive to nearly everyone; but a good school system may be counted as a + by a parent with young children and a – by a house- owner with no children because of the high real estate taxes engendered, while an unmarried male without taxable property is indifferent to the situation. (p. 50)

In this quote, we see that a pull factor for one person could be a pull factor for another person. This is an important idea to keep in mind. Just as push and pull factors may be different for different people, push and pull factors may change in a post apocalyptic setting.

In Lee's model, positive (pull) and negative (push) factors as well as intervening obstacles play a role in the choice to move.

In Lee’s model, positive (pull) and negative (push) factors as well as intervening obstacles play a role in the choice to move.


Origin and Destination Factors and Intervening Obstacles in Post-Apocalyptic Migration

Notice the diagram of the push and pull factors in a post apocalyptic scenario. Zombies are probably a push factor for nearly everyone. Food and resources would be a pull factor. However, we must keep in mind the push and pull factors of zombies. It is probably safe to assume that zombies will be pulled to a location that has more humans (zombie food).

Origin and Destination Factors and Intervening Obstacles in Post-Apocalyptic Migration: Zombie Perspective

By considering the movement of zombies and other humans, it would be possible to stay a few steps ahead of everyone else. Before migrating to a new location, consider possible migrations of other humans and zombies. Determine if you will be ready to deal with these other migrations.

Lee, E. S. (1966). A theory of migration. Demography, 3(1), 47-57. http://www.jstor.org/stable/2060063

  • / By

Project 07 – Planning Your Survivor Settlement!

Project 07 has been uploaded to the Member Downloads directory.

Here is the direct link if you are logged in. There you can either download the individual files or a single PDF of all of the project 7 documents (52 pages).

Here is an introduction to the project:

And here is an outline of the unit:

Exciting next couple of weeks for ZBL! As if all the other weeks haven’t been exciting?!

  • / By
Maps » Population Density Maps

Maps » Population Density Maps

If you’re teaching, learning, or working on a project that requires you to find resources on population density, make sure you check out the Global Rural-Urban Mapping Project (GRUMP) hosted at Columbia University. They compile data from NASA nighttime photos from space to create maps of where people are located (the same method used in ZBL Project 01 and Dead Reckon).

Take a look at the site and browse some of the awesome maps they have. If you are doing any research of a country, these maps will be valuable to you. You can even register to download specific data.

Maps » Population Density Grid, v1: Global Rural-Urban Mapping Project GRUMP, v1 | SEDAC.

  • / By

Human Migration and the Zombie Apocalypse! Project 06 is uploaded!

“Like” this post for 3rd project upload this week! All of Project 06 has been uploaded to the Member Downloads directory.

Here is the direct link if you are logged in. There you can either download the individual files or a single PDF of all of the project 6 documents.

Here is an introduction to the project: [download id=”222″ format=”1″]

And here is an outline of the unit: [download id=”223″ format=”1″]

I’m really excited to be getting print versions of Dead Reckon this week. I’m also getting all of the T-Shirts. Kickstarter rewards will be shipped soon.

I’m also really excited to finish posting the core projects so I can provide all of the digital add-ons. I’ll tell you more about those later!